Thursday, May 28, 2009

FW: Slippin' away


The Fed isn’t having a good afternoon.  Their plan to hold interest rates low is being undone by forces yet unknown.  The 5 year Treasury auction went well this afternoon.  The Treasury sold $35 billion worth of 5-year bonds, there was good participation, and all was calm.  About an hour after that auction Treasury prices began falling…and MBS prices were falling too…at an even faster rate than Treasuries…this is an unusual thing.  The 10 year pulled back at a very rapid pace until it was down over a full point. 


I picture Bernanke and Geithner in an office staring blankly at a Bloomberg as they realize that they’ve spent hundreds of billions of dollars on MBS and Treasury securities over the last few months and they currently losing their shorts on those positions.  I would guess that it is difficult even for the Ivy League economics professor to maintain his cool in the face of it.  If it were me I can imagine the Bloomberg terminal being verbally and physically abused over the remainder of the day.


There is no specific news yet on what is driving today’s pullback.  It’s not a gigantic move in Treasuries but it is material and it was unexpected.  You can always gauge the magnitude of the surprise factor by the pace of the chatter going “over the box” as we call it (we have a worldwide intercom system that allows us to maintain real-time communication with the rest of the firm).  The chatter picked up after the 10-year  dropped by over the half a point, and as it approached a one-point loss the there were people scrambling  and talking over each other in a rapid-fire staccato trying to get things done before the situation deteriorated any further.  A one-point move on the 10-year Treasury generally doesn’t raise too much of an alarm in a market where we’ve seen record volatility (think back to the nine-point intra-day move we had late last year).  So while the magnitude of this afternoons movement isn’t even close to being a record it is having a chilling effect on the market due to the surprise factor.


The general trend in rising Treasury yields appears to be coming from an uneasiness in the market regarding the Treasuries ability to place as much debt as they need to bring.  Supply may simply overwhelm demand. 


If you were looking to sell bonds you’ll be looking at much lower prices today as Treasury prices fell AND spreads widened (mainly on MBS).  If you were looking to buy bonds then today is probably a very nice day to do so.  I can’t imagine the Fed and Treasury just throwing their hands up and saying “there’s nothing more we can do”.  It wouldn’t surprise me to see them up the size of their buyback plan from their current $300 billion amount to something much more material.  If you can buy on a pullback before the Fed counter-attacks you may have an opportunity to pick up some spread.


Below are two screens showing today’s Treasury market activity and the movement in the yield curve over the last month.


If there is anything I can be doing for you just let me know.


btmm 5 27 09.png


c15 5 27 09.png


Thursday, May 21, 2009

Market Update 5 21 09: More people out of work


Treasuries pulled back this afternoon pushing the 10-year bond yield back up to 3.37%. There is an increasing amount of chatter that the Fed is considering raising the stakes on their Treasury re-purchase program. The current ceiling on the program is $300 Billion. As we’ve discussed before that isn’t a terribly large amount of money in terms of overall Treasury market volume.


The ranks of the unemployed continue to multiply

Today’s Initial Claims number was expected to show that there were 625,000 new claims for unemployment benefits over the prior week…it actually posted 631,000. That marks the 16th consecutive week that Initial Claims has posted above 600,000. It is an ugly, ugly trend.

We also got a look at Continuing Claims today. There are now 6.66 million people drawing unemployment benefits. This is a number that needs some perspective. If everyone in the country had to get their unemployment benefits check from the same office, then the line of 6.6 million people would stretch from New York to Los Angeles. I assume in this analysis that each person would take up 2 feet of space…personal space is always an issue.

For the northern California folks it would be from San Francisco to Philadelphia.

For our Florida friends it would be from Orlando to Seattle.

And for the folks in Texas we’re talking about a line from Dallas to Panama City, Panama; or somewhere in the Arctic Circle…tough line to be in but you can’t go 2,500 miles east or west out of Dallas without having a lot of the people in the Atlantic or Pacific.

If I DROVE to the back of the line it would take me 4 days and I would burn $375 in gas.

I’ve attached a chart of the Continuing Claims data below.

There is no more economic data scheduled for release this week.

If you have any questions or if there is anything I can be doing for you please let me know.


Wednesday, May 13, 2009

Market Update 5 13 09 _ Retail Sales ain't sellin'


Treasury prices are rising and stocks are off this morning on lower Retail Sales numbers. The 10 year Treasury had traded as high as 3.30% recently and is now being driven down below the 3.10% level.

I read a story on Bloomberg this morning stating that the low retail sales number was a surprise. I look around the office and I don’t see anyone here surprised by it. Consumers aren’t having the best time lately. Initial Jobless claims is posting over 600,000 per week for 14 straight weeks, credit card rates for many borrowers are pushing 30%, credit card limits have been cut, home equity lines have gone away, the survey predicts unemployment to continue rising, and Americans on average have had an abysmal savings rate over the last few years. I’m all for big screen TV’s but where are the consumers going to get the money to spend?


This morning’s economic releases are below. I’ve highlighted the Retail Sales numbers that are moving the market this morning.


Anecdotal Evidence

Car dealer commercials provide a nice bit of anecdotal evidence as to the state of consumer spending. I hear them all the time on the radio while I’m driving in to work and every now and then they broadcast one that gives me a very clear signal as to the health of the economy.

Before the meltdown really began back in 2007 I heard the car-guy on the radio using his big car-dealer-radio-voice and he says/shouts “I’m thinking of a three digit number that doesn’t matter….IT’S YOUR CREDIT SCORE!!!” That commercial highlighted for me the prevailing state of risk management in some segments of our economy at the time. At that moment I laughed out loud at the thought of the poor folks that had been buying securitized auto loans. If I owned Asset Backed Securities and I heard that commercial I might have wrecked my truck.

Fast forward to May 2009. The most recent ad that gives me a clear indication as to the state of the consumer is the plan where the dealer will take your car back from you at no cost if you lose your job. This is different than the regular way they take your car back after a job loss…that being by repossession…this one is better. In the current economy people are actually starting to do the rational thing…they are saving more which by definition means they will spend less. This means dealers will sell fewer cars. BUT dealers have come up with a way to allay your concerns about job loss. If you buy a car today they are offering to take it back from you with no penalty if you lose your job. Who could argue with that right?

Well I’ve got a few minutes to think about that deal as I drive to work. I think that the conceptual basis of the ad misses a lot of consumers. In fact this has the potential to morph into one of those classic studies on the rationality of consumers. This ad essentially boils down to telling an over-leveraged consumer that is concerned about catastrophic job loss that the best course of action is to leverage up even more. After all what could possibly go wrong? We’ll take the car back. Never mind the pile of cash you could have had in the bank as a backstop in case you lose the job. In the car companies plan I guess you can live on the memories of the Hyundai they took back from you. The alternate ad slogan could be “We’ll make sure you lose your job and your car at the same time.”

I hope the American consumer doesn’t take that bait. I hope that this episode in our financial history is one that pushes people back toward financial responsibility, and I hope that the retail sales numbers are a sign that maybe that is occurring. A seismic shift like this has to have some pain…consumers have a mountain of debt to pay off. Every dollar put toward debt reduction is a dollar that can’t be used for consumption…in fact that dollar was already used for consumption and is just now being used to fill in the hole.

The shape of the consumer

I’ve attached two graphs that I think help to paint a picture of the situation faced by the consumer right now. The first graph below shows the growth in Total Consumer Credit from 1980 to this month (excluding loans secured by Real Estate). This has become a mountain over time. We have just recently seen a turning point in the ever increasing slope of this line.


The graph below shows the national savings rate as measured by percentage of disposable income saved. You can see that in prior time periods Americans saved more in general.


You can see that savings rates between 6% and 10% were fairly common during the 1980’s. The trend beginning in the 1990’s was that savings rates dropped. In fact they kept dropping to the point where the savings rate on average went negative…that’s a pretty aggressive use of credit, but hey when times are good there is nothing to fear right?

I’ve written in the past that I would expect this savings rate to begin moving back up. Fear is a very strong motivator. I would expect some continued improvement in this metric. The graphs we just covered (total debt and personal savings) paint a picture of a consumer with his back against the wall. He’s got a mountain of debt sitting on him, increased odds of losing his job, no cash to fall back on, and car dealers trying to take what little discretionary cash flow he’s got left. It’s tough to picture a sustained rally in Retail Sales when there is so much work to be done paying off debt and building savings.

I’m certain that there are some consumers hoping for the government to ride in on its spending horse and save the day. It would appear that those consumers are between Barack and a hard place.

If you have any questions or if there is anything I can be doing for you just let me know.

Tuesday, May 12, 2009

Interpolated Yield Curve forecast for May

Each month Bloomberg surveys 60 to 70 economists to get their estimates of where Fed Funds, the 2-year Treasury, and the 10-year Treasury will be over the next several quarters. I take this data and interpolate for the points in between the survey data to create the attached report. This allows us to get a broad view of where various economists see interest rates going over the coming quarters.

We continue to get a forecast that doesn’t show Fed Funds trading higher than 1.00% until the furthest time period in the survey. It’s clear from the numbers below that nobody expects Fed Funds to be rising in 2009. That forecast isn’t surprising given the trend of the economic data coupled with the Feds statements that they plan on keeping rates low for quite a while.

As I worked this up this morning I took a look at the Bloomberg forecast for the Unemployment Rate. The average forecast for 2009 is 8.95%. The 2010 forecast rises to 9.38%. As I wrote in the Market Update earlier this week it doesn’t look like we’re in for a quick “V” shaped recovery.

If you have any questions on this material please let me know.


Monday, May 11, 2009

Reflections of a slow day

No economic data was released today. Treasuries rallied quite hard ending the day with the 10 year up just over a point, pushing it's yield back down into the 3.16% area. Forgive my imprecision, it's late and I'm not near my Bloomberg...I'm working off memory here.

There has been some decent volatility in the government bond market recently. Part of the market knows the Fed wants to keep rates artificially low to help consumers and businesses have access to cheap credit, thereby stimulating the economy. Another part of the market knows however that the Fed doesn't have pockets deep enough to pull this off by themselves. Adding to the confusion is that nobody knows what the Fed will do next...will they boost the $300 billion Treasury purchase program? Will they do nothing and watch the 10-year Treasury slowly creep up toward 4.00%...killing their hopes of a refi-wave induced by artificially low mortgage rates?

Nobody has a clear idea at this point and the various market forces are moving against each other like techtonic plates...creating friction.

The Fed doesn't seem to be very aggressive in their buying lately. Their open market operations have been tepid. Going on memory I recall that many times the Primaries will offer $36 billion or so in product and the Fed might take $6 or $7 Billion of it. The Fed gave some lip service to buying less if the "green shoots" of economic growth progressed into a recovery. I think they'll be forced back into the market before long.

What to buy?

The question we keep getting is "what bonds look good?" The answer we keep giving is "none look good...but some look OK."

Most banks are expecting inflation to come back with a vengeance in response to the current level of government spending. They've got good reason to be worried.

Because the primary fear is inflation, the primary response is to stay short. Inlation kills the value of a stream of fixed payments....bonds. The guy that goes long right now to get yield is the same guy that is going to get crushed when rates rise on inflation concerns.

Most everything that banks like to buy looks terrible...especially from the viewpoint of a buyer that is paying north of 2.00% to bring deposits in the front door. Where do you go with 2.00% money? 1 year bullets at 0.67%? That's a nice way to lose 133 basis points.

3 year non-call 1 year paper at a 2.16% and pick up 16 bps? Hardly worth the effort.

MBS?

I began writing to you quite some time ago about the widening of spreads on mortgage backed product. This began waaaaayyyy back when the hedge funds started to get in trouble. The bad assets they held generated losses, which led to writedowns, which led to margin calls. They couldn't sell the junky stuff at that big a loss so they sell the good stuff that is highly liquid...Agency MBS were among the highest quality bonds they owned.

The worse the market got, the more margin calls came in and the more MBS they had to sell. Fear began to drive the markets and pretty soon there was so much selling of MBS to meet margin calls that we saw spreads that historically run at 125 bps over Treasuries start to blow out to 250 bps, then 275, then 300, at the highs there were in the 315 bps range.

Everything I wrote at the time preached mean reversion...when the turmoil subsides spreads will go back to a more normal range and those that bought at +300 will enjoy massive spread tightening. NOTE: Spread tightening is caused by prices rising, thereby pushing yields (spreads) lower. So the guy that bought a bond at $100-4 back in October is now sitting on a price in the 104 range. 4 points of profit largely due to spread tightening.

What about MBS now?

It's difficult to find and MBS under $103. With premiums this high I can't overemphasize the importance of structure. A 30 yr 5.00% MBS and a 10 yr 5.00% MBS are two completely different creatures when it comes to prepay risk.

The 30 year borrower has tons of incentive to refinance his mortgage as a large percentage of his monthly payment is comprised of interest. Those 30 year pools can generate some terrifying prepay speeds...which will kill your yield if you bought it at a premium.

The 10 year borrower by contrast has a much smaller percentage of his monthly payment that is interest...so he is less senstive to movements in mortgage rates. Now consider that he is already in the shortest mortgage vehicle available right now and you can see that this pool doesn't have near the incentive to prepay as does the 30 year pool.

10 year MBS have prepay histories that are slow and steady. This is "structure". If you have to buy at big premiums, at least buy a structure that will provide as much protection as possible. The trick is that 10-year MBS paper is difficult to find currently. I saw at most...maybe $4 million of new production 10 year paper for May. I'm sure there is more out there but it's getting put away quickly.

In summary, 10 yr MBS are very attractive compared to most other product we're seeing right now (keep in mind this is written from the perspective of a bank investment portfolio manager...other investors have other needs and constraints that change the view of what's attractive...or even permissible).

That ends a rambling look back at today.

Friday, May 8, 2009

Market Update: What's the shape of a recovery?


The definition of “good news” has apparently changed

There is a lot of talk going on in the news about how much better things are looking for th economy. It doesn't FEEL like alot of good news based on the conversations I'm having with bankers around the country every day; but just to make sure I looked up the meaning of "good news" on the off chance that I was missing something.

This is the meaning of "good news" from the dictionary: -noun, informal

"someone or someting that is positive, encouraging, uplifting, desirable, or the like."

Despite what is being written in the news I can’t classify much of the recent news as positive, encouraging, uplifting, or desirable. LESS BAD I can label it…but good news is a stretch.

The “good” and the “less bad”

We’ve got Initial Jobless Claims that are beginning to ebb but still running well north of 600,000 per week. In the last few weeks we’ve seen factory orders falling, personal income figures lower than the estimates, and durable goods orders lower than expected. There are still huge amounts of debt on personal balance sheets, massive government spending that I would expect to be a drag on future growth prospects, several icons of American manufacturing prowess that are on their deathbeds, and the government is still deeply entrenched in the private sector with no talk of getting out. I think I’m more of a realist than a pessimist…it’s just that reality at the moment happens to look bad.

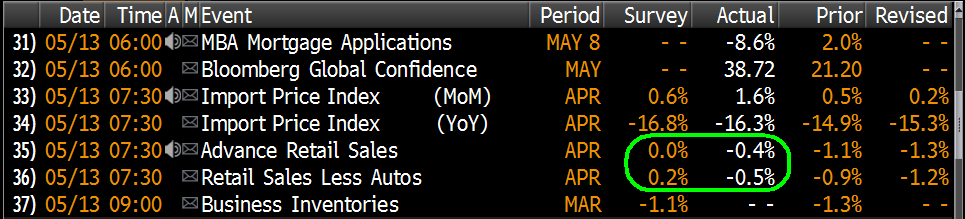
This morning’s big releases were Initial Jobless Claims and Continuing Claims. Initial Jobless Claims came out below the estimate, posting 601,000 vs. an estimate of 635,000. This is the 14th consecutive week that the economy has shed over 600,000 jobs.

Continuing Claims show that 6.35 million people are currently drawing unemployment benefits. Bloomberg provides data going back to 1968 on continuing claims. The chart below shows the trend in Continuing Claims from 1968 to last month. You can see that we are clearly in record territory in terms of the NUMBER of Americans collecting unemployment benefits. Keep in mind that the unemployment RATE may not be at a record level because the size of the workforce in 2009 is larger than that of previous cycles. For example last month’s 8.5% unemployment rate applied to today’s work force of over 150 million people will mathematically put more people on the Continuing Claims rolls than the same rate applied to the 1900 labor force which was around 20 million people.


One of the more interesting bits of “good news” was Consumer Confidence. It was up. In the current environment it is tempting to completely ignore consumer confidence. Rising consumer confidence in this market doesn’t compute. These are the same consumers on average that carry large credit card balances with skyrocketing rates, can’t get a loan, are losing their jobs, and whose homes have lost almost 20% of their value over the last year. If these people are confident, I’m not sure they understand what’s really going on.

Some of the news actually is good news. One such story has been the reduction of inter-bank borrowing costs as measured by Libor. This is a very good sign that the fear in the credit markets is beginning to wane. Capital flows in the market are like oil in the economic engine. Without proper flow the engine will seize up. This is a legitimate good news story.


What’s the shape of a recovery?

We all want economic recovery. We want jobless rates down, productivity up, and increasing stock prices that reflect a strong and vibrant future for the health of our economy as a whole. Despite some “less bad” numbers, it would appear that we are a long way from that reality.

With regard to economic recovery you generally hear the talk in terms of the “shape” of the recovery. There is the “V” shaped recovery where GDP drops sharply then rebounds off the bottom just as sharply to form a “V” shape in a chart. There is a “U” shaped recovery where you drop, travel sideways for a bit and then pop up. Finally there is the “L” shaped “recovery” where you hit the deck and just travel sideways with no material growth for quite some time.

Gimme an example

An airplane in flight provides a nice analogy for the shape of economic recoveries. Under normal circumstances an airplane is going to take off and follow a gentle slope of increasing altitude. We’re all familiar with this right? All of the passengers are moving in the same direction, they are calm, happy, and thinking about their destination (ultimately retirement in the case of the economy). Upon reaching its target altitude the plane will just cruise along at a comfortable pace. The economy growing with roughly 4.00% annual GDP growth is akin to an airplane mid-flight when all is well and everyone is happy. The seat belt sign is turned off, you are free to move about the cabin, and you get free pretzels.

A recession is like losing one engine…some lights are going off in the cockpit, some radio calls are made, and priorities are shifted around to accommodate the situation. In this stage the seat belt sign is lit, you need to stay in your seat, they put the drink cart away, passengers become concerned but nobody is freaking out. After all, these pilots are professionals it should all work out OK...right? It’s a bit disconcerting but ultimately the plane lands, gets fixed quickly, and gets back to altitude. Think of this as the “V” shaped recession.

A bad recession is like losing all engine power and stalling (definition of a Stall - an instance or the condition of causing an airplane to fly at an angle of attack greater than the angle of maximum lift, causing loss of control and a downward spin). The flight path takes a decidedly negative turn, begins a steep dive, and the pilot can’t tell you if you’re going in nose-first, or if he’ll be able to restore power and pull out of it. The passengers are no longer calm…in fact I’d like you to picture the scene from the movie Airplane when the stewardess tells the passengers that they are out of coffee. The passengers are in full freak-out mode at this point, some are even smoking in the lavatory despite the fact that it’s a violation of federal law (think initial jobless claims over 600,000 for 8 weeks in a row, home prices falling nationwide, a potential run on banks nationwide, big well known companies going bankrupt, and massive government interference in the free markets). People are praying that the pilots know what they’re doing but many are beginning to have serious doubts about the outcome of this flight. Ultimately the pilot gets one engine going….and after a good scare the plane lands, you spend a few days to a week at the airport, things get fixed, and you get back to altitude. Think of this as the “U” shaped recession.

Another possible outcome of the bad recession is where the pilot manages to keep the plane from drilling a hole in the earth with the nose cone, and instead is able to pull out of the dive juuuuuuussssst enough to glide in on the belly of the plane…hitting a lot of things along the way, banging everyone up, and losing some luggage, but ultimately everyone survives. This is the “L” shaped recovery. At this point you can de-plane, look back across the trail of smoking debris leading up the aircraft, and you begin to figure out how to get this thing back in the air.

The difference between a bad recession and a depression is whether or not the plane can pull out of the dive…we’ll skip the depression landing.

Which recovery will we get?

Assuming we only use these three possible scenarios I think it is possible to discount a “V” shaped recovery. I see nothing in the data that points to a rapid recovery, and I can’t find anyone that thinks we’re just going to bounce off the bottom and get right back to normal. There are far too many problems in my opinion to allow that to happen.

If it’s a “U” I hope we land in a place that’s at least tolerable until we can get back in the air. And if it’s an “L” I might spend my retirement living with my kids. I’ll have to keep that in mind as I assign chores over these next few years. It might be in my best interest to have their mother assign the tough ones and I’ll give out the easy stuff…winning hearts and minds.

Some real good news

Many banks are stepping into the markets to raise new capital…and doing so quite successfully. I spoke with a bank yesterday who raised $60 million in a stock issuance that was four-times over-subscribed. That is not only a sign of a strong bank, but of a system that is no longer paralyzed with fear.

If you have any questions on this material or if there is anything I can be doing for you just let me know.

Tuesday, May 5, 2009

A quick update

Tuesday, May 5, 2009

Much to report lately but not enough time. 80 hour weeks aren't leaving much time for writing. A stream of consciousness method might be best here. There are some signs that the economy isn't deteriorating AS QUICKLY as it has been. This is for the most part being viewed in the market as a sign that we are close to a bottom. However...I don't know of anyone that thinks we're going to bounce off the bottom and just start growing again. Jobless Claims are still mounting at a pace north of 600,000 per week. An important consideration here is that a good number of the jobs we are losing are STRUCTURAL job losses as opposed to transitory job losses...these jobs won't be coming back when the economy rebounds. GM and Chrysler simply won't need as many employees...many of those jobs are gone permanently.

When does the economy start growing again? Even though the economic damage is accruing at a slower pace we've still taken some tremendous hits. I saw a quote today that had the amount of value lost in the housing sector as over $6 Trillion. That's not just going to re-inflate to pre-recession numbers....nor should it. I was at dinner last year with the President of the St. Louis Fed and he had a nice chart that showed where housing prices WOULD have been if they tracked GDP growth instead of following the rapid growth path that was fueled by speculation. I'll have to dig that chart up because it was quite insightful. Essentially it showed that after the collapse in home prices to that point (and I want to say this was back in Sept of 2008...but don't quote me on the timeline) we were really just in line with where prices SHOULD be if they grew at the same pace as GDP.

Moving on still in stream of consciousness mode...and I apologize I'm in between work and studying for CFA Level 2...I've got my hands full. The big news recently was that the 3.00% level was breached on the 10-year Treasury. There was much speculation that the Fed wanted to keep the 10-year yield below 3.00% to help ignite the refi wave. There was compelling evidence of this in the markets until last week. At the April FOMC meeting Bernanke and Co. announced a surprise. There was speculation that they would EITHER announce a plan to buy Treasury debt OR announce a plan to buy Agency debt...they did both. The plan calls for spending $300 billion to buy Treasuries and an additional $750 Billion to buy Agency debt (bullets and MBS). This is on top of the $600 Billion in MBS purchases they had announced in January.

So on this announcement the 10 year Treasury yield dropped like a rock. It appeared that through open market operations the Fed was going to keep the 10-year in the 2.80% range. As much money as the Fed has, they don't have pockets deep enough to keep the 10 year at a predetermined level. The market won that battle. After a disappointing volume of purchases in open market operations one day last week the 10-year popped above the 3.00% level...then it was off to the races.

For its part the Fed says they don't have a target level for the 10-year. They say they will consider all evidence as they deploy the money in these programs. If economic growth picks up they can pare back on purchases, the opposite also holds.

That is a rambling recap of some of the bigger items recently. Sorry about the format...it's a product of necessity. Support the economy...buy bonds.